



Description
All 6 lessons are complete — learning why percentages compare groups fairly, tell qualitative data apart from discrete and continuous data, choose the best graph for a data set, learning what makes an infographic clear and convincing, learning how adding or removing a value changes the mean, median, and mode, and spot a misleading graph.
Every lesson comes with a full teaching set: a lesson plan, a worksheet, homework, and a handout. The unit also includes 6 exit cards, 2 quizzes, a project, and an assignment.

Grade 7 · ready for Monday
What's in this unit
-
1

Plan
6 lesson plans, each one 40-minute period, with what to say and what to watch for.
-
2
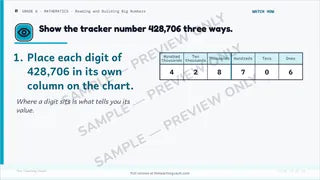
Slides
The lesson on the board, one step at a time, with each answer on the next slide.
-
3

Printouts
A worksheet, a handout and homework for every lesson.
-
4

Assessment
6 exit cards, 2 quizzes, a project, an assignment.
-
5
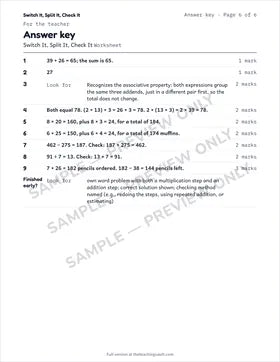
Answer keys
At the back of every worksheet, homework and assessment.


The 6 lessons
- 1
 Comparing Groups with Percentageslearning why percentages compare groups fairly and build a percentage table from counts
 - 2Three Kinds of Datatell qualitative data apart from discrete and continuous data and collect data that actually answers a real question
- 3Choosing and Building Circle Graphschoose the best graph for a data set and build a circle graph with the correct angles
- 4Telling a Data Story: Building an Infographiclearning what makes an infographic clear and convincing and build an infographic that tells a true story about data
- 5How One Value Can Change the Whole Picturelearning how adding or removing a value changes the mean, median, and mode and learning how one value can change the shape of a data set
- 6Reading Data with a Critical Eyespot a misleading graph and use data to make a convincing, honest argument

- Read-Me-First — open it before anything else; one page that says what each file is for
- One numbered zip per lesson: lesson plan, worksheet, homework, handout and a one-page lesson read-me
- A zip for the 6 exit cards; a zip for the assessments: 2 quizzes, a project, and an assignment
- Every file as a print-ready PDF and an editable Word document; the lesson plan also as a PowerPoint deck to project
In every lesson
- Lesson plan
- Worksheet
- Homework
- Handout
For the whole unit
- 6 exit cards
- 2 quizzes
- A project
- An assignment
- Every format included — PDF, DOCX & PPTX
- Comparing Groups with Percentages
- Three Kinds of Data
- Choosing and Building Circle Graphs
- Telling a Data Story: Building an Infographic
- How One Value Can Change the Whole Picture
- Reading Data with a Critical Eye
- Each lesson fits one 40-minute period; the plan is written for a substitute to teach cold
- Prints cleanly in black and white; nothing depends on colour
- Answer keys on the teacher pages at the end of every worksheet, homework and assessment
- In My files right away, and by email.
- Zips open on any computer; on a phone, save them to Files or Drive first
- Licensed to one teacher for one classroom — not for sharing with colleagues or your school. Full licence terms
- Digital files are final sale; if something is wrong with a file we'll fix it
- Questions: support@theteachingvault.com
Reviews
You may also like


Mathematics
Grade 7 Geometric and Spatial Reasoning — Full Unit Try Lesson 1 free4 lessons


