

Description
All 6 lessons are complete — sort real situations into ones that need data about one thing and ones that need data about two things measured together, collect continuous data for two variables from the same subjects, match a data set to the graph type that fits it best, learning what an infographic is and why real organizations use them, describe a relationship's strength: strong, weak, or none, and read graphs and tables to answer real questions, including ones that need a further step of reasoning.
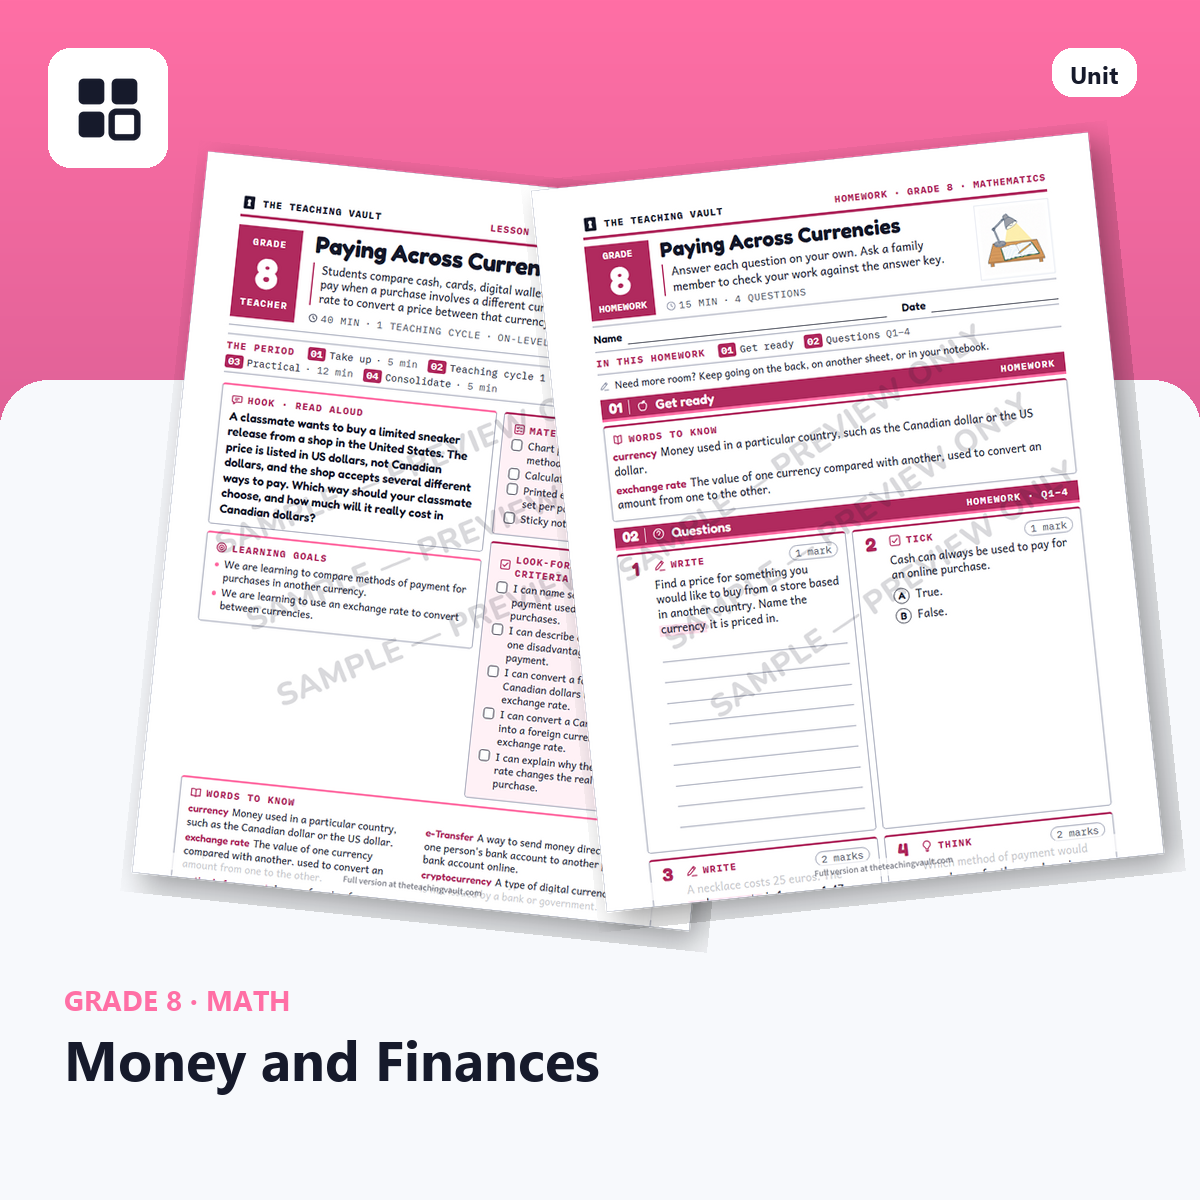
Every lesson comes with a full teaching set: a lesson plan, a worksheet, homework, and a handout. The unit also includes 6 exit cards, 2 quizzes, a project, and an assignment.

Grade 8 · ready for Monday
What's in this unit
-
1

Plan
6 lesson plans, each one 40-minute period, with what to say and what to watch for.
-
2
Slides
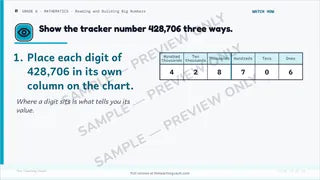
The lesson on the board, one step at a time, with each answer on the next slide.
-
3

Printouts
A worksheet, a handout and homework for every lesson.
-
4

Assessment
6 exit cards, 2 quizzes, a project, an assignment.
-
5
Answer keys
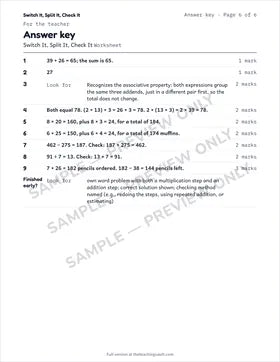
At the back of every worksheet, homework and assessment.


The 6 lessons
- 1
 One Variable or Two?sort real situations into ones that need data about one thing and ones that need data about two things measured together and explain that choice using a real example
 - 2Collecting Paired Datacollect continuous data for two variables from the same subjects and organize paired data into a table of values
- 3Choosing the Right Graphmatch a data set to the graph type that fits it best and justify a graph choice with a real reason
- 4Telling a Story With Datalearning what an infographic is and why real organizations use them and build an infographic that tells a clear, honest story about a data set
- 5Describing Relationships in Datadescribe a relationship's strength: strong, weak, or none and describe a relationship's direction and explain an outlier's effect
- 6Reading Data With a Critical Eyeread graphs and tables to answer real questions, including ones that need a further step of reasoning and spot a misleading graph and explain why it distorts the data

- Read-Me-First — open it before anything else; one page that says what each file is for
- One numbered zip per lesson: lesson plan, worksheet, homework, handout and a one-page lesson read-me
- A zip for the 6 exit cards; a zip for the assessments: 2 quizzes, a project, and an assignment
- Every file as a print-ready PDF and an editable Word document; the lesson plan also as a PowerPoint deck to project
In every lesson
- Lesson plan
- Worksheet
- Homework
- Handout
For the whole unit
- 6 exit cards
- 2 quizzes
- A project
- An assignment
- Every format included — PDF, DOCX & PPTX
- One Variable or Two?
- Collecting Paired Data
- Choosing the Right Graph
- Telling a Story With Data
- Describing Relationships in Data
- Reading Data With a Critical Eye
- Each lesson fits one 40-minute period; the plan is written for a substitute to teach cold
- Prints cleanly in black and white; nothing depends on colour
- Answer keys on the teacher pages at the end of every worksheet, homework and assessment
- In My files right away, and by email.
- Zips open on any computer; on a phone, save them to Files or Drive first
- Licensed to one teacher for one classroom — not for sharing with colleagues or your school. Full licence terms
- Digital files are final sale; if something is wrong with a file we'll fix it
- Questions: support@theteachingvault.com
Reviews
You may also like


Mathematics
Grade 8 Geometric and Spatial Reasoning — Full Unit Try Lesson 1 free4 lessons